
InfluxDB v2 as Datasource for Grafana
Intro
In the last blogs (Grafana with podman kube and Setup MQTT Broker, IoT Devices and Security ) I explained how to setup Prometheus , Grafana and Mosquitto as MQTT Broker to visualize the data from IoT devices, mainly from Shelly. In this blog I will explain how to setup InfluxDB v2.6 and use it as additional datasource for Grafana.
Why Prometheus and InfluxDB? Many of my devices send only a new MQTT message with new values, if the difference to the old value is big enough. This can take several hours (or even days), something where I have big problems to handle that with Prometheus, which scrapes the metrics in a regular interval. In my experience, InfluxDB is also better suited if you want to measure the power created by our balcony power plant. And that’s one of my goals.
Setup
As usual, I run InfluxDB v2.6 as container managed with podman kube on openSUSE MicroOS .
The directory layout for the configuration file is similar to the other services:
/srv/influxdb2/
         ├── data/ -> for the persistent data
         └── etc/ -> for the configuration data
WARNING InfluxDB changes the ownership of the data to UID
1000. This is really bad, since this UID is the first user UID on Linux distributions and thus normally already in use. Means, your first normal user can access, read and modify the InfluxDB2 data!
The problem is known since now 5 years, the only workaround is to run the container as another user, not root. But this prevents influxdb from adjusting the permissions and ownership of the directories, so the admin needs to know what influxdb needs. Containers from other projects solved that in an user friendly way: you can specify which UID the process should use.
So at first you should make sure, that the UID 1000 is not used on your system. Second, create an user influxdb with this UID to avoid any security problems in the future:
useradd -u 1000 -r influxdb -d /srv/influxdb2Yes, useradd will most likely warn you that influxdb's uid 1000 is greater than SYS_UID_MAX, but since this is only a warning, you can ignore that.
No configuration file is needed: it will be created at the first start of the container and first login.
Podman kube
The YAML configuration file (influxdb2.yaml) for podman kube play
looks like:
apiVersion: v1
kind: Pod
metadata:
  labels:
    app: influxdb2
  name: influxdb2
spec:
  containers:
  - name: server
    image: docker.io/influxdb:latest
    ports:
    - containerPort: 8086
      hostPort: 8086
    volumeMounts:
    - mountPath: /var/lib/influxdb2
      name: srv-influxdb2-data-host-0
    - mountPath: /etc/influxdb2
      name: srv-influxdb2-config-host-0
    resources: {}
    securityContext:
      capabilities:
        drop:
        - CAP_MKNOD
        - CAP_NET_RAW
        - CAP_AUDIT_WRITE
      privileged: false
  restartPolicy: unless-stopped
  volumes:
  - hostPath:
      path: /srv/influxdb2/data
      type: Directory
    name: srv-influxdb2-data-host-0
  - hostPath:
      path: /srv/influxdb2/etc
      type: Directory
    name: srv-influxdb2-config-host-0
status: {}
This configuration uses the latest upstream InfluxDB v2.x container, which listens on port 8086.
That’s already all we need.
Run Container
Now we just need to start the containers:
podman kube play influxdb2.yamlThe command podman pod ps should show you at least one pod:
POD ID        NAME        STATUS      CREATED         INFRA ID      # OF CONTAINERS
7dfeecb0b16c  influxdb2   Running     36 seconds ago  aebf2050aeca  2
InfluxDB setup
After the InfluxDB container runs, connect with a webbrowser on http://hostname:8086/ to it and you should see the following welcome screen:
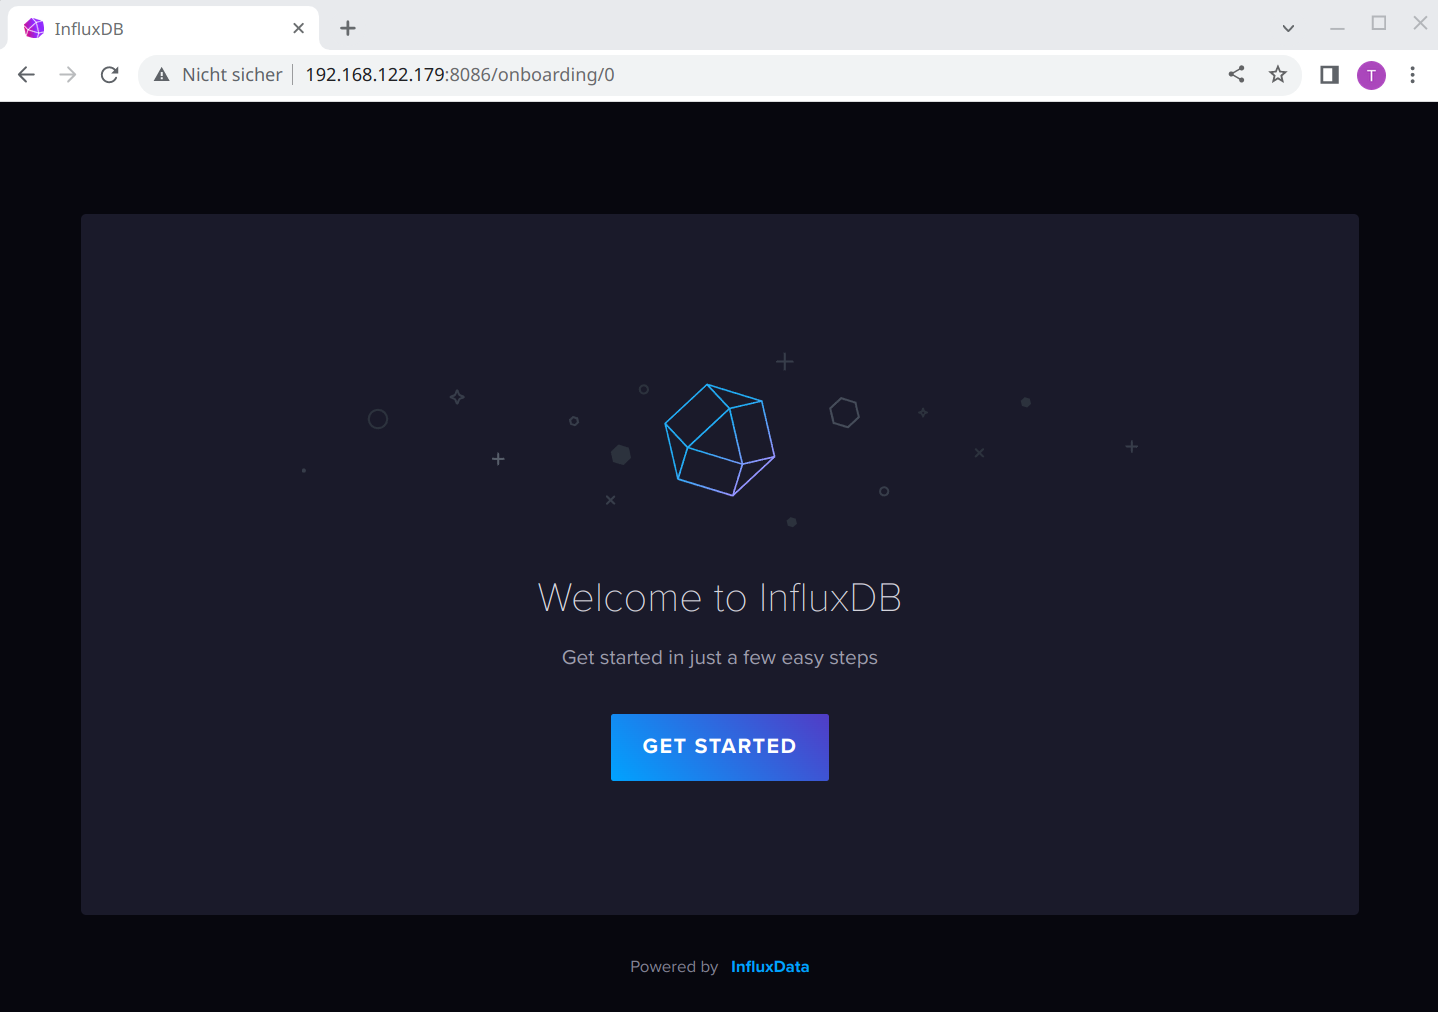
Select Get Started and you should see the first mask to enter all necessary data for the initial configuration:
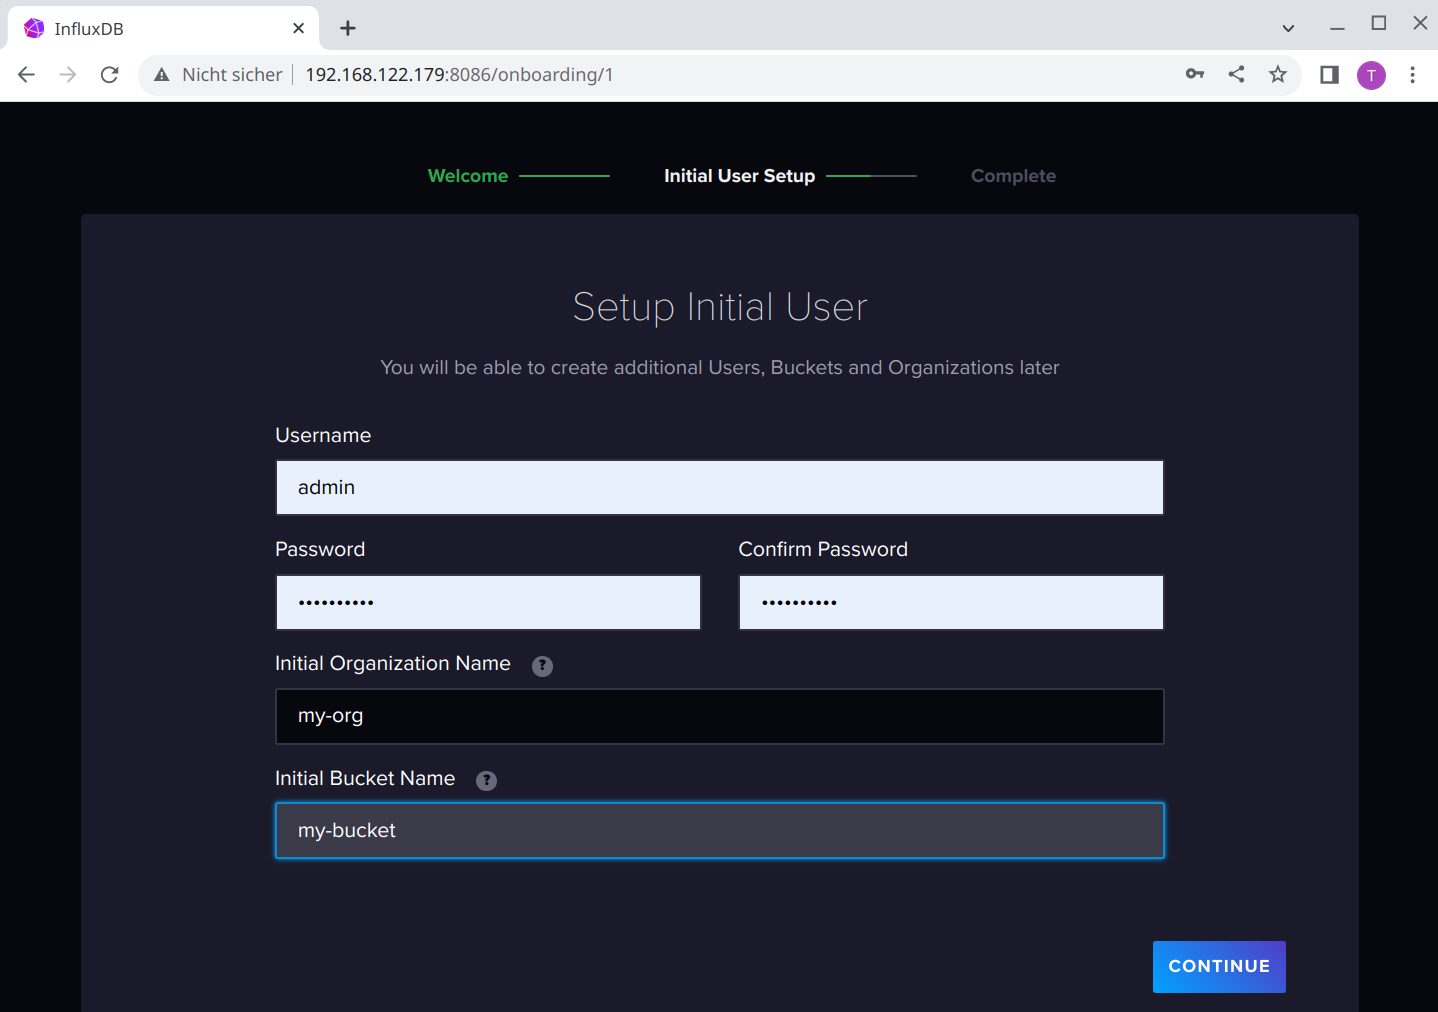
I use as Username always admin, but you can choose whatever you want. Else the passwords, the first Organization Name and the first Bucket Name are required.
There is only one thing we need to do in the UI: generate a token, so that Grafana can read the data.
For this, select Load Data and here API Tokens:
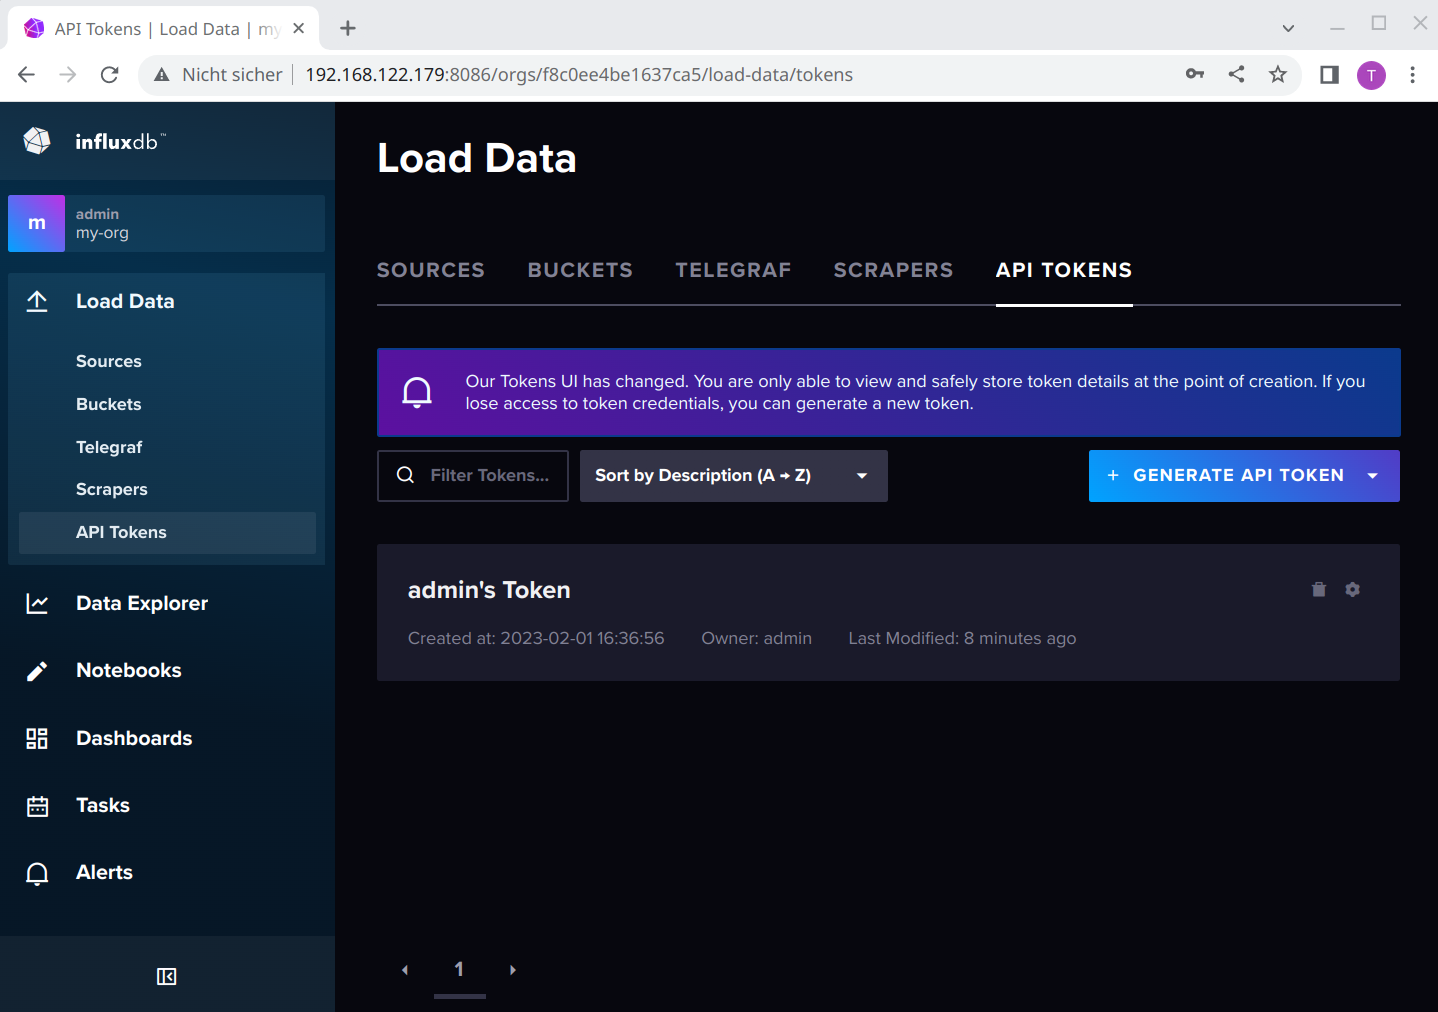
InfluxDB does not allow you anymore to view the token after you created it. This is valid for the admin’s Token, too. But for the admin’s Token there is a simple solution: if you need that later to authenticate yourself with e.g. the influx CLI, you can find it in /srv/influxdb2/etc/influx-configs.
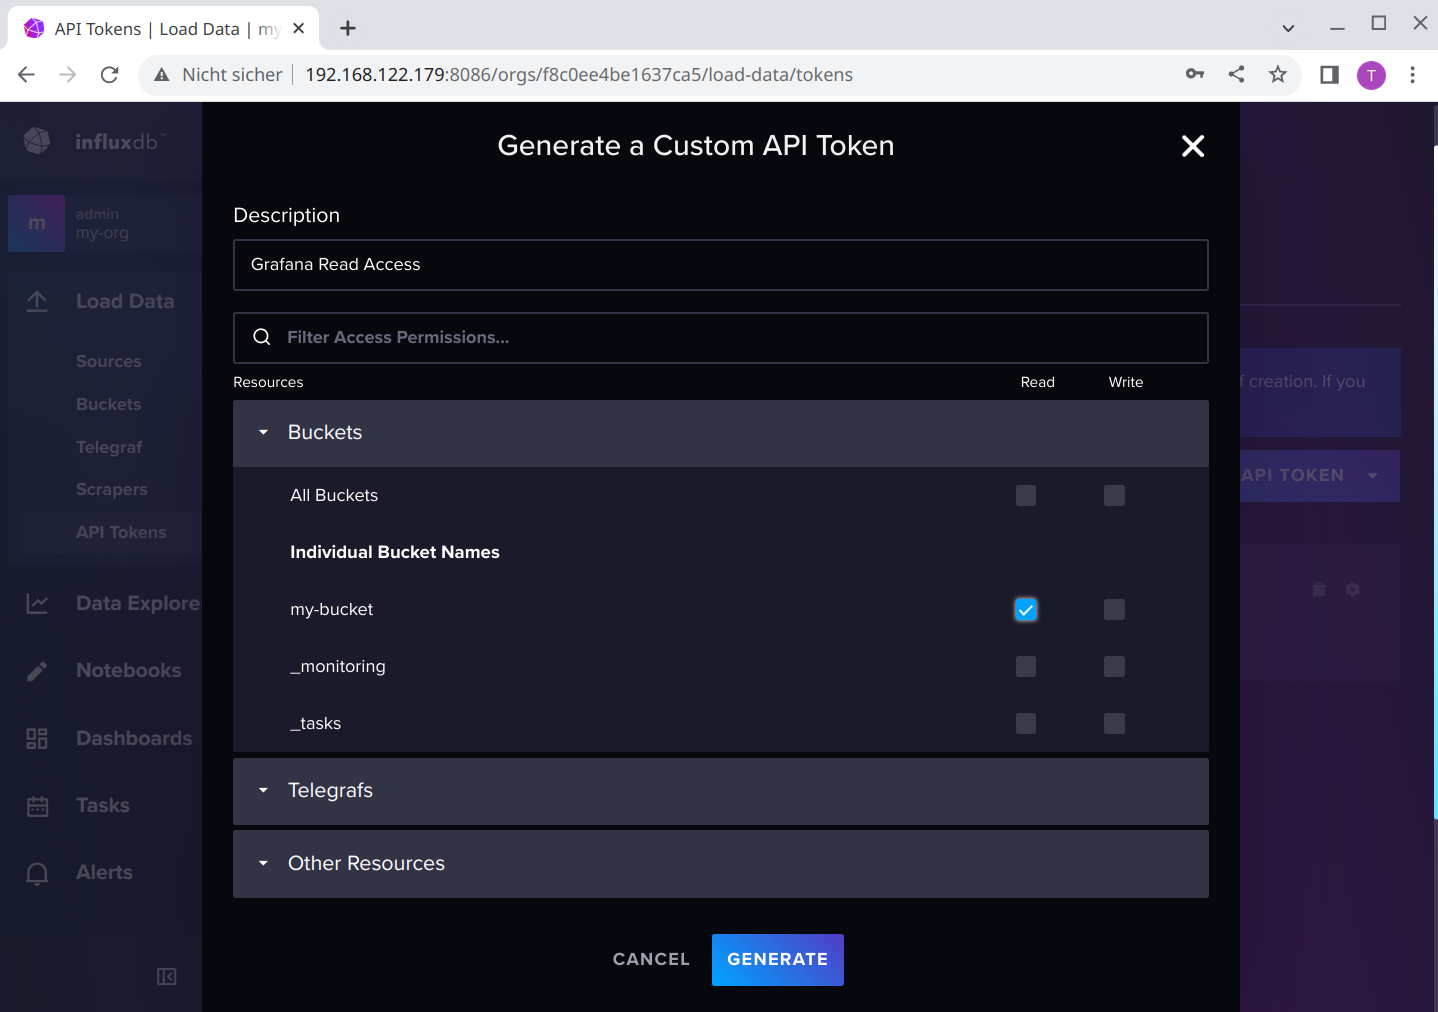
For Grafana, we generate now a new API Token, in this case a Custom API Token, as we only need read access to the bucket:
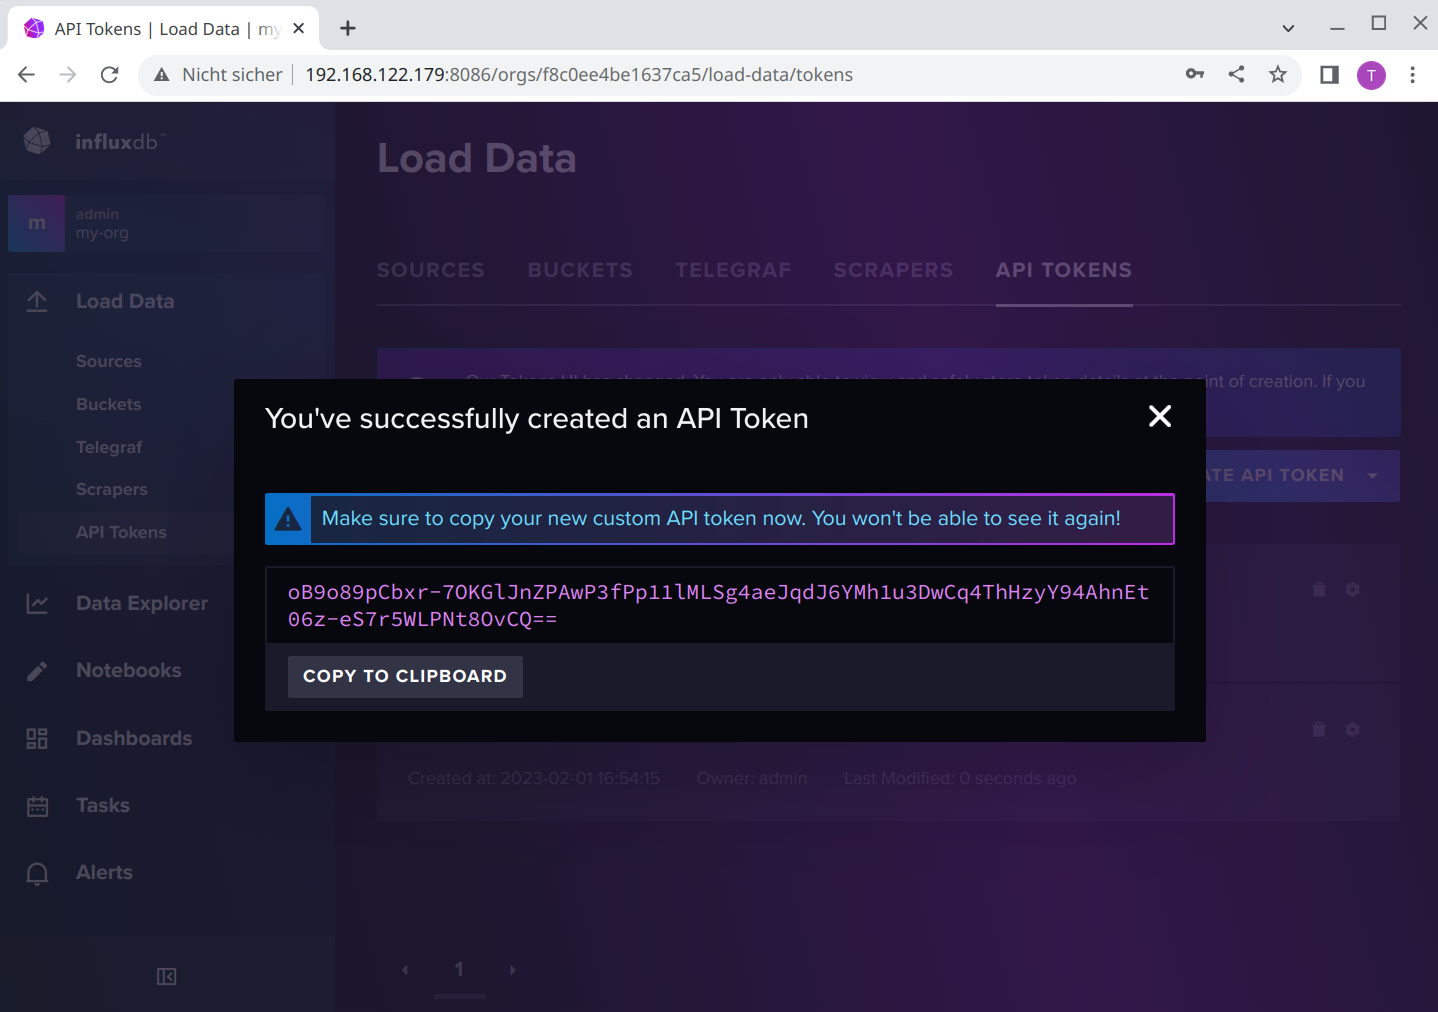
Now securely save this API Token for Grafana:
Add InfluxDB as Datasource to Grafana
Login to Grafana and select Configuration -> Data sources. Here we add a new data source and select InfluxDB from the list.
InfluxDB v2.x provides two query languages: “InfluxQL” and “Flux”. Here I will show for both how to add them. To differentiate the data sources later, I always add the query language to the database.
InfluxQL
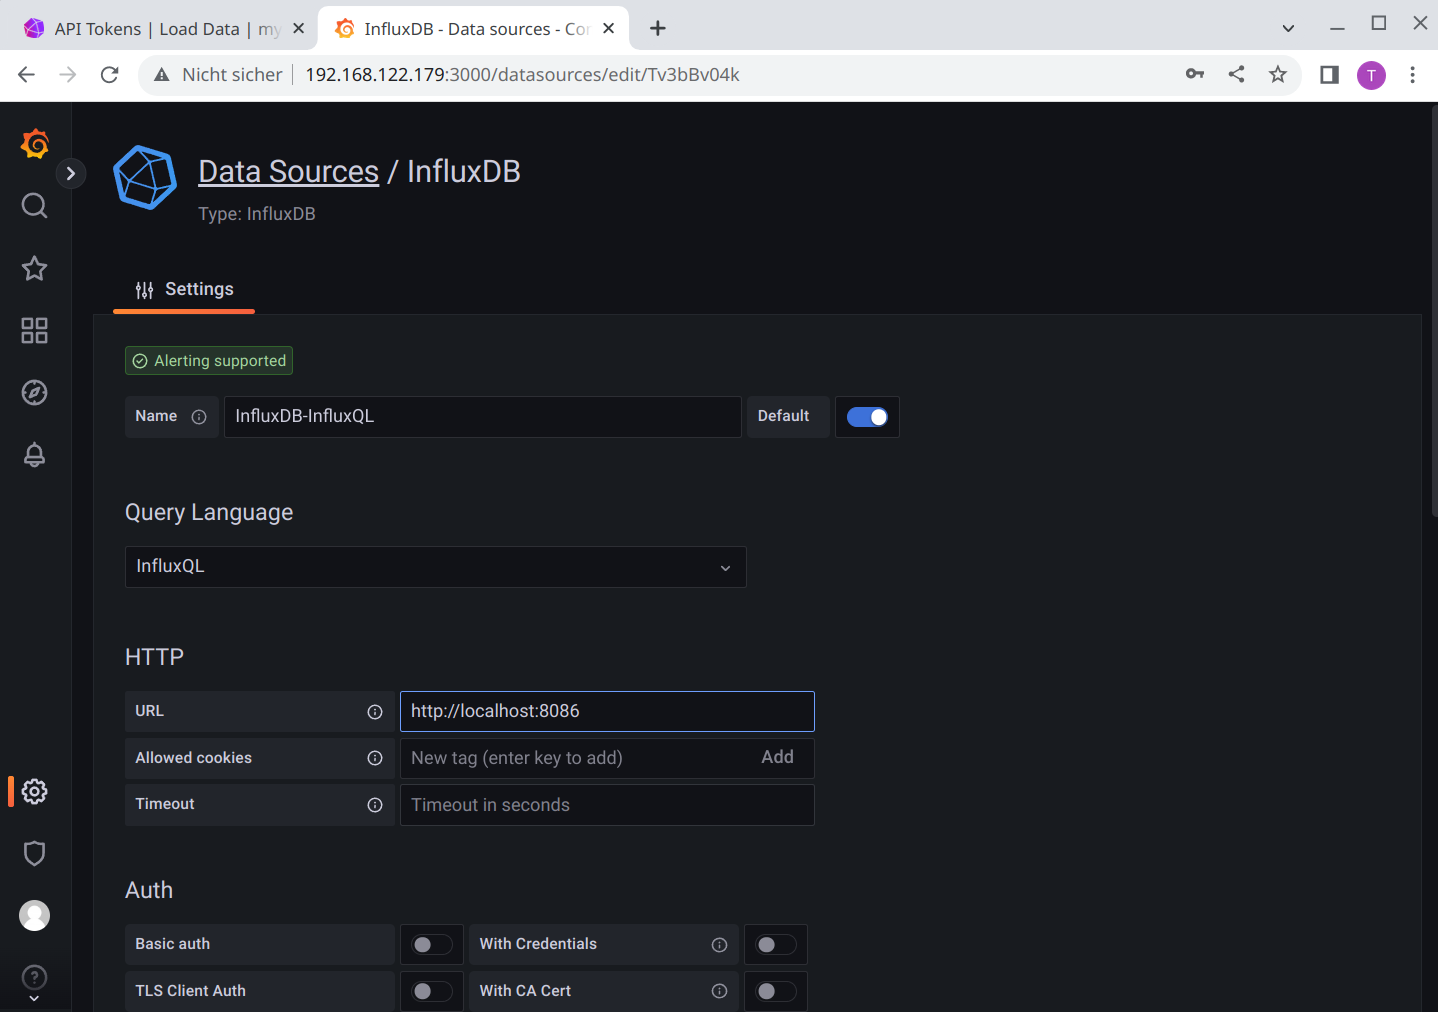
Settings for InfluxQL:
Namewould be InfluxDB-InfluxQLQuery Languagewould be InfluxQLURLwould be the InfluxDB URL http://<hostname>:8086. If Grafana and InfluxDB run in different PODs as described in this blog series,localhostwill not work, it must be the real hostname or IP address.
Now comes the tricky part. If you strictly followed the documention from InfluxDB and Grafana, you most likely saw already the “famous” error reading InfluxDB. Status Code: 401 message. At least this did happen for me the first days, and I found a lot of hits with google, but no real solution. There are many comments how to modify the database and what you need to create to “solve” this issue, but from my experience: this is not necessary. All you need to do is to add the Token in the correct format as Custom HTTP Header. In most documentation it’s described wrong, if it is mentioned at all.
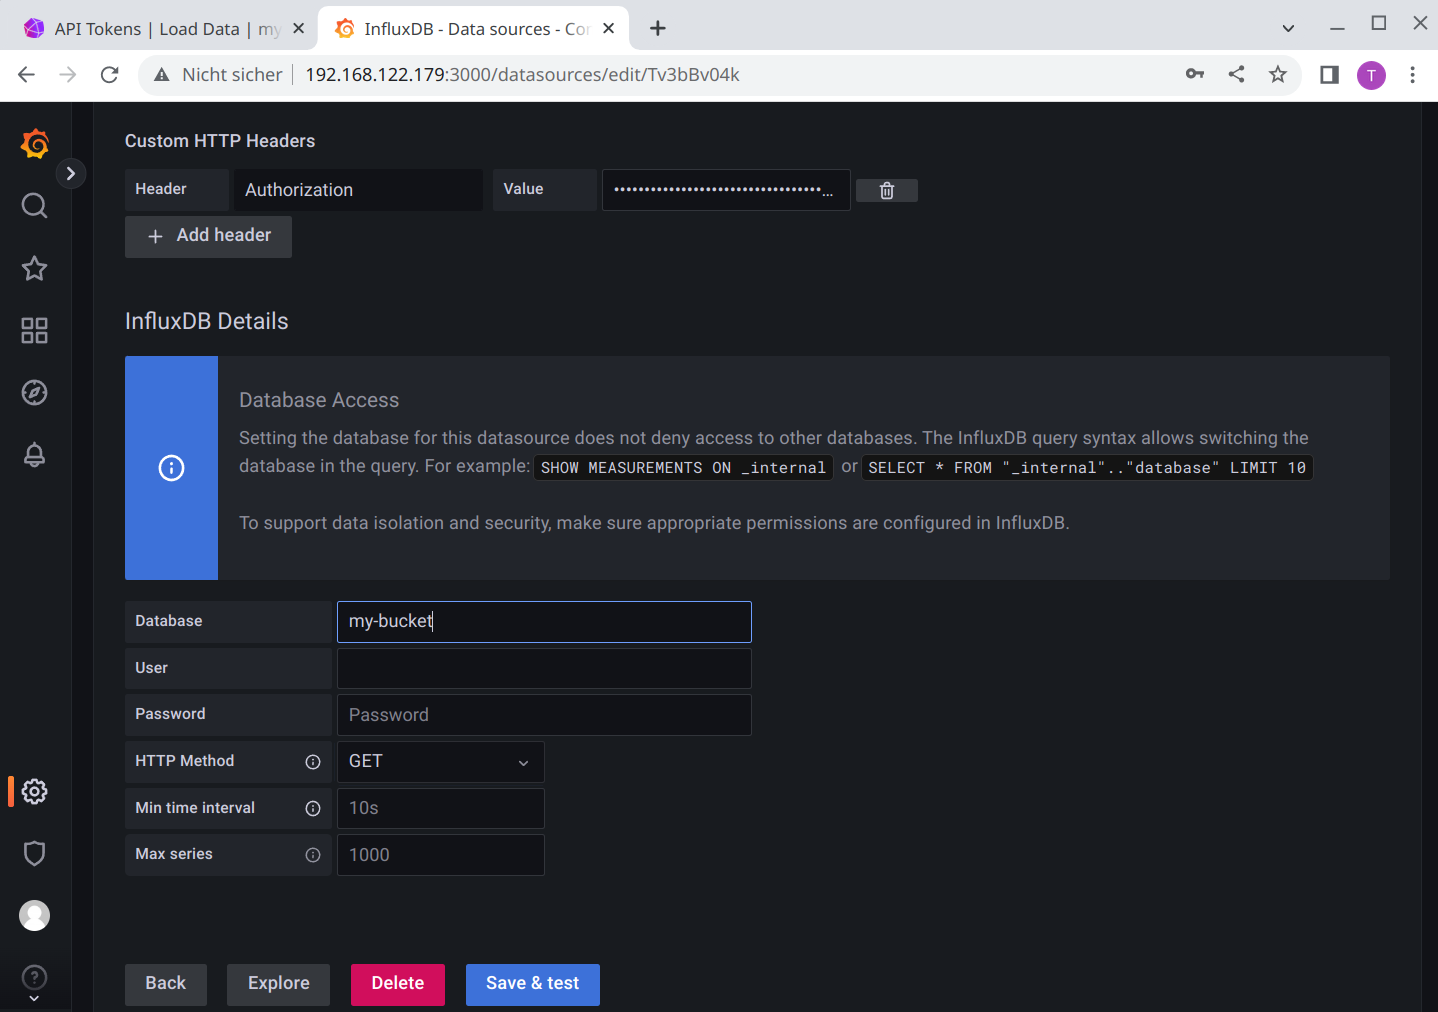
So this is what works for me:
Headeris “Authorization”Valueis “Token <API Token>”
And for the InfluxDB Details:
Databaseis here my-bucket (or whatever you did choose for the initial database)Userstays emptyPasswordstays emptyHTTP Methodsould be GET
I got User and Password only working, if I migrate from an InfluxDB v1.x installation to InfluxDB v2.x, and all databases had a workig user with password. But even in this case it did not work for every database. Generating tokens is much easier.
Save & test should give you a green message datasource is working. XX measurements found. If you get an 401 error, Grafana could not authenticate itself against the database.
Flux
Now we add a second datasource with “Flux” as Query Language. Go back start again with adding a data source.
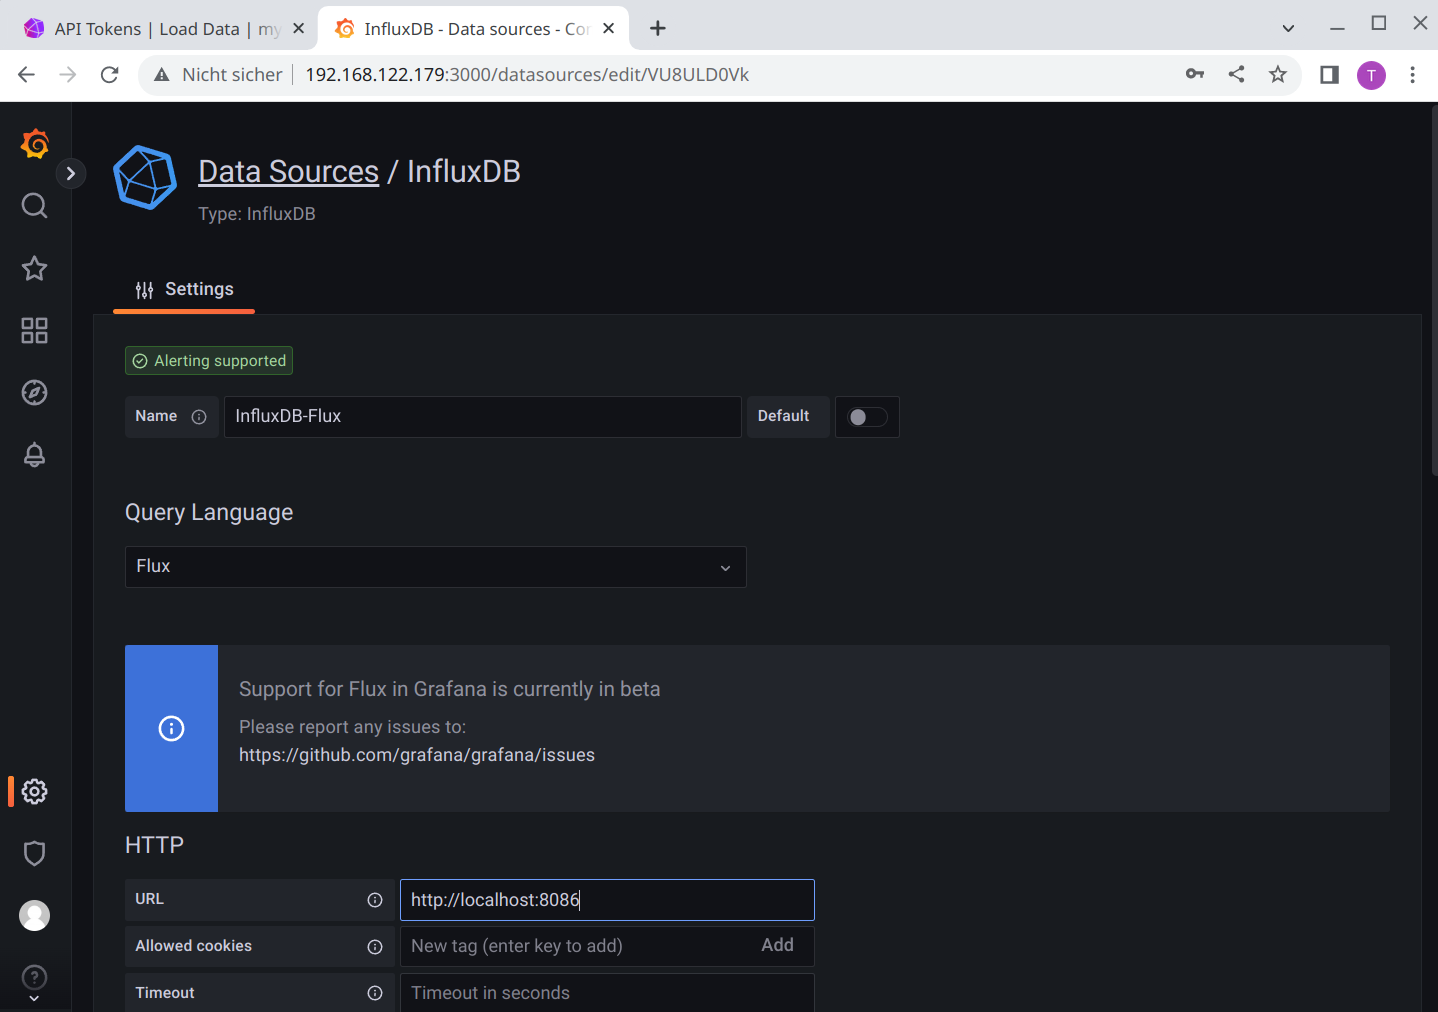
This time we use:
Namewould be InfluxDB-FluxQuery Languagewould be FluxURLwould be the InfluxDB URL http://<hostname>:8086. If Grafana and InfluxDB run in different PODs as described in this blog series,localhostwill not work, it must be the real hostname or IP address.

Disable everything in the Auth section, especially the default Basic auth. We don’t need to add a custom HTTP header, too.
For the InfluxDB Details we use:
Organizationis the organization you created in InfluxDB, in this case my-orgTokenis the same token we used for InfluxQL generated in InfluxDB. It only needs read permission for the bucket. Enter the pure token, no “Token” prefix is necessary as for the HTTP header.Default Bucketis the bucket where the data should be fetched from by default, in this example this would be my-bucket
Save & test should give you a green message datasource is working. XX measurements found.
Outlook
Now we have a MQTT Broker running, which collects the data from our IoT devices, we have Prometheus, which can scrape the data from configured sources, we have InfluxDB v2.6 as timeseries database and Grafana, which uses Prometheus and Grafana as data source. In the next blog I will explain, how to close the last gap: how to get the data from MQTT into InfluxDB.